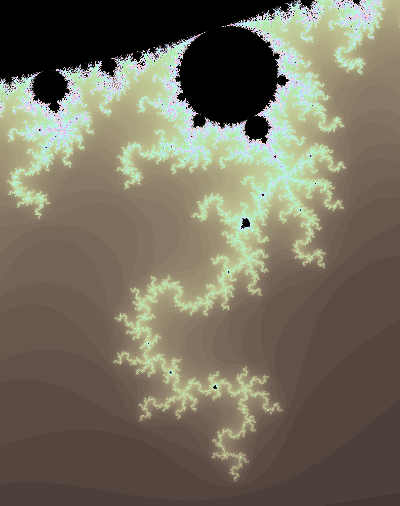
Images relating to the Mandelbrot Set are all over the Internet. Producing yet another program to create images from the calculation of this set is therefore nothing remarkable. Nor is it particularly difficult. Yet it is worth doing for several reasons.
Firstly, however much we see new examples of such images they grab the attention. Most Mandelbrot-related images are instantly recognisable as such, yet they are all distinctly different from each other. In fact, once you starts to zoom into local regions of the Set boundary there is a fair chance that you are producing images that in detail are unlike any produced before because there is an infinite amount of variation to be explored. It is that knife-edge between randomness and order that seems to be especially intriguing to the human brain.
A second reason for programming this algorithm is that it does illustrate a number of useful techniques, and also some interesting algorithmic ideas. The fundamental algorithm underlying the calculation is fairly simple, but the results are visually rewarding. I suggest that these are good characteristics for a motivating learning exercise.
These exercises also start to open up a much wider field of investigations into fractal images (for example, the closely related Julia Sets, which are perhaps not so familiar to most readers as the Mandelbrot Set). The mathematics of fractals are very much bound up with an important field of complex dynamics and chaos theory. The complexity of fractal images on the boundary between order and disorder is related, for example, to the difficulty of predicting the weather even when we know all the initial conditions and the precise equations governing their evolution into the future. Fractal images are a great way to illustrate some of the maths (and mathematically inclined people love them more than most) but for the mathematician they are not the real point.
